
Beyond traditional software asset management, software license optimization brings about the most immediately apparent business justification for acquiring advanced engineering software management tools.
However, it is an ongoing process that must always start with a full understanding of your true software license usage.
As the complexities of software entitlements and the IT environments of global enterprises increase, determining their actual license usage becomes more difficult.
True concurrency of usage across different time zones must be taken into consideration.
A distinction must be made between active and inactive license usage. User behavior must be examined. And many other factors must also be regarded before the actual license usage can be ascertained.
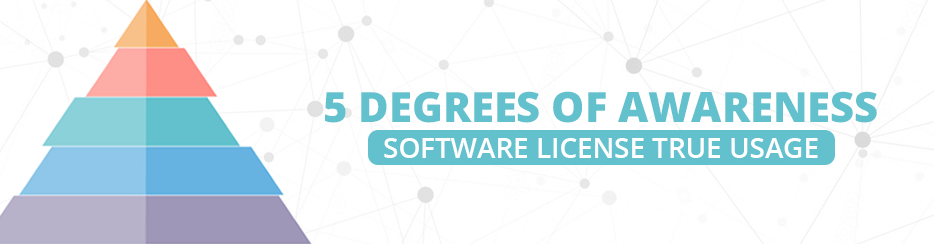
Here are five reports that could help increase your level of awareness of your company’s true license usage.
I. Enterprise Overview
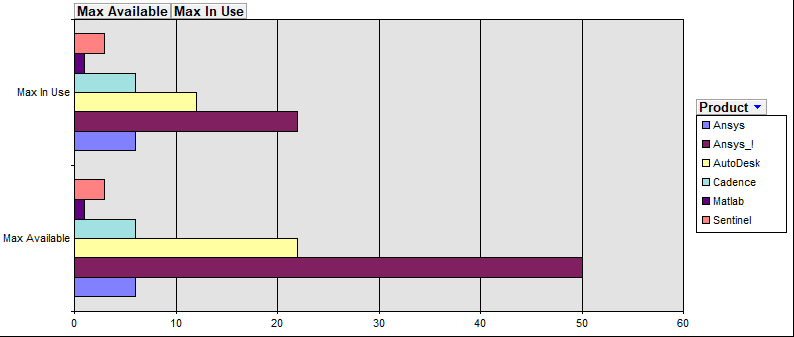
An enterprise overview provides a glimpse of the total license usage for all software applications across the entire enterprise.
A quick comparison between the maximum number of available licenses and the maximum number of licenses that were checked out concurrently would give an idea of the actual licensing needs.
Looking at the maximum number of licenses in use and comparing it with the total elapsed time could show which applications are frequently checked out and which ones are used for longer periods of time.
And factoring in the number of distinct users and the number of denials could show how popular the application is.
Comparing the number of distinct users with the maximum number of licenses in use could expose potential user behavior issues.
However, enterprise overviews cannot tell the whole story. For that, we need to dig deeper and break down the information.
II. Feature-Level Breakdown
If there are interesting numbers on the product overview, it may be necessary to drill down to the specific features of that product to see what is causing the anomaly.
A feature-level breakdown should show the same measures, but these are broken down into each specific feature of the application.
There may be features that have very high utilization. However, there may also be features that have never been used.
And if the company is paying for the licenses of features that are not being used, it may be better to reallocate the budget to purchase more licenses for features with high utilization.
Or, if these features should be used, it may be prudent to investigate why they are not being used.
On the other hand, if a feature has unexpectedly high utilization, it would also be sensible to further look into its utilization to see why and how it is being used.
III. Daily Utilization
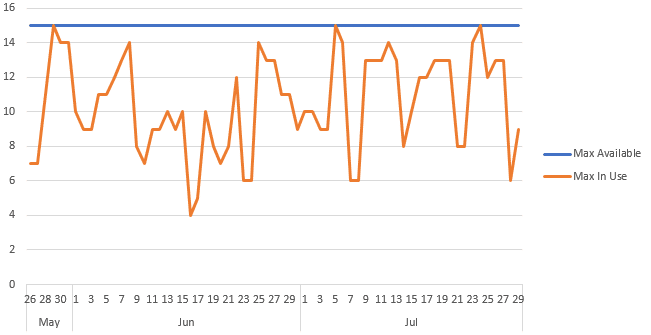
Drilling down to daily utilization could reveal the peaks and valleys of license usage.
For instance, the reports may show that the maximum number of licenses in use for a feature was 200, but for a whole year, it could have happened only once.
Therefore, it is an exception and purchasing additional licenses may not yet be necessary.
If, however, the daily utilization trend is consistently high and the number of available licenses is consistently being maxed out, coupled with a bunch of denials for having all available licenses checked out, it may be time to consider purchasing more licenses for the feature.
However, before deciding on purchasing more licenses, it would be wise to look first at the license efficiency for the feature.
IV. License Efficiency
IV. License Efficiency
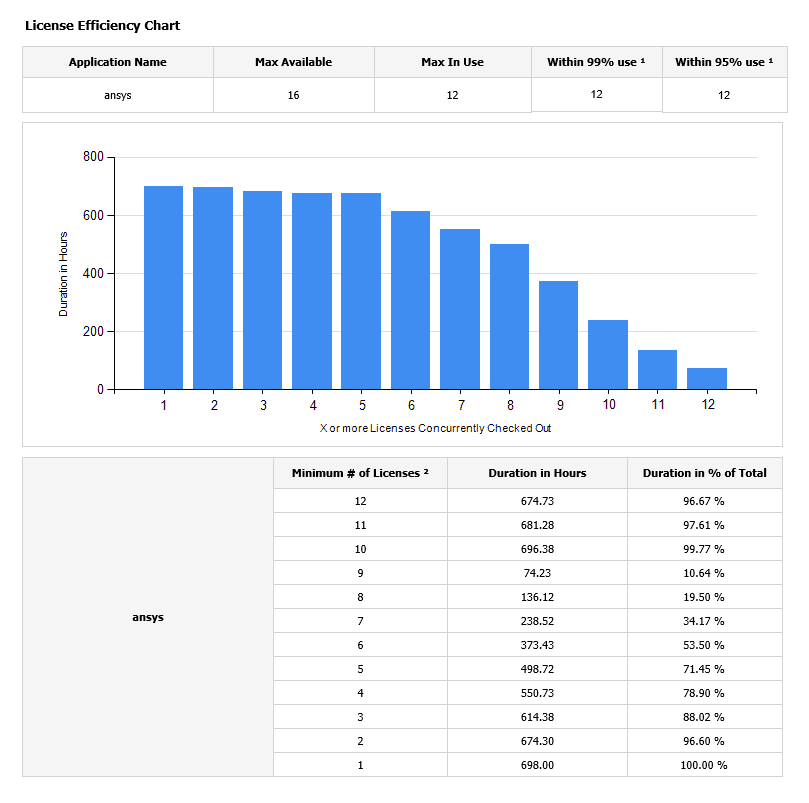
Even if the number of available licenses is often maxed out, it is possible that this is only for a minuscule amount of time.
License efficiency would show the amount of time that a certain number of licenses have been checked out concurrently.
For instance, if reports show that the number of available licenses was maxed out, but the license efficiency chart shows that it was only for 0.05% of the time, purchasing more licenses may not yet be necessary.
In fact, if the license efficiency chart shows that fewer licenses are needed 99% or 95% of the time and it is acceptable to get a few denials for those times, it may even be a good idea to reduce the number of licenses for that feature to save some costs.
Furthermore, it may be necessary to look deeper into inefficient license usage to find out more ways to save costs. In this regard, user-level reports can help uncover more areas for improvement.
V. User-Level Breakdown
Drilling down into the user-level usage can reveal possible license camping and license hogging behaviors.
If certain users are checking out more than one license at a time when they are not supposed to, then it may be necessary to call this to their attention and correct the behavior.
The same is true for users who fail to release the licenses after they are done for the day or for the weekend.
Unless corrected, these behaviors may deprive other users of using the feature and artificially inflate the licensing needs.
In fact, if users utilize the available licenses more efficiently, the company may find that it actually needs fewer licenses.
If you can’t measure it, you can’t improve it. – Peter Drucker
If you are not aware of your true license usage, you will not be able to optimize it.
Understanding your true license usage is the first step towards software license optimization, which in turn leads to cost optimization and huge savings.
And the level of your awareness and understanding often dictates the level of optimization that you can implement and the amount of savings you can get from it.
Find out more about understanding your true license usage.
Let us guide you through your software license optimization journey.